
Get in Touch with IDA


Quick Specs
| Typical passes to sub-5μm | 3-5 passes, depending on roller diameter and speed ratio |
| Gap precision (production-grade mills) | Down to ≤1μm, hydraulic/servo models |
| Common speed ratios | 1:2:4 (moderate shear) to 1:3:9 (high shear, finer targets) |
| Primary test methods | ASTM D1210-05(2022) grind gauge, ISO 13320:2020 laser diffraction |
| Span formula | (D90 − D10) / D50. |
Three roll mill particle size refers to how fine a paste or paint gets dispersed by the machine’s rollers, most often reported as a Hegman grind-gauge reading or a D50/D90 laser-diffraction value. Hitting sub-5 micron three roll mill particle size has long been a Holy Grail for many operators, by one simple means: tightening the gap more. That works – for a while – until it doesn’t. Once you’ve got an already tight gap, and a high speed ratio, the fineness reading plateaus exactly where it did on the previous pass, and tightening the gap another notch does nothing except heat the material and wear out the rollers faster.
Sub-5μm three roll mill particle size is obtained with 3-5 passes at a matched speed ratio (typical 1:2:4 to 1:3:9), checked with an ASTM D1210-05(2022) grind gauge and, for more tight quality control, the ISO 13320:2020 laser diffraction charts D10/D50/D90 and span – tightening the gap does not help any further with fineness once roller wear, a viscosity-shear mismatch, or an agglomerate ceiling become the bottleneck.
💡 Key Takeaways
- Tightening the roll gap doesn’t always result in a lowered D90 – the rollers can wear out, a viscosity-shear mismatch can develop, or an agglomerate ceiling can stall fineness at even the tightest gap.
- grind gauge readings and laser diffraction reports measure different things – a passing Hegman reading doesn’t necessarily mean a passing D90 spec.
- A 1:3:9 speed ratio can produce sub-5μm fineness in 3 passes on an 80mm roller, compared to 5 passes on a 50mm roller – roller diameter, not throughput, changes pass count.
- Span – (D90 − D10)/D50 – measures the range of sizes present; two batches with the same D50 can have very different spans.
- The ISO 13320 was updated from the first edition of 2009 to the second edition in 2020, but many published guides of particle-size information – including several that currently dominate search results on the topic – still reference the 2009 book.
How a Three Roll Mill Creates Fineness, and Why “Tighten the Gap” Stops Working Below 10μm

A three roll mill creates particle-size reduction by pulling material through two narrowing nips between three counter-rotating rollers running at increasing relative speeds; the growing speed differential between adjacent rollers generates the shear force that breaks down agglomerates. Tightening the gap further stops improving fineness below about 10 microns because the bottleneck shifts from gap width to roller wear, a viscosity-to-shear-rate mismatch, or an agglomerate ceiling — three separate failure modes that a tighter gap alone cannot fix.
three-roll mills (sometimes also written three roll mill) reduce particle size by dragging material through two nips formed between three horizontally positioned rolls – the feed roll, the center roll, and the apron roll. adjacent rolls rotate in opposite directions at different speeds, with each rolling step faster and faster than the last, and it’s this relative speed gap between the rolls that creates shear force. Material taken up by the feed roll enters the first nip (between feed and center rolls), and is already pre-dispersed. It then enters the second nip (between the middle and apron rolls), moving faster still and where the shear force is highest in the line. It’s this increasing difference in relative speed that breaks down agglomerates and disperses pigment, resin, or active-ingredient particles into the vehicle that surrounds them, and it’s the same mechanism whether the final product is a paint, an ink, a coating, or a cosmetic base.
An efficient three roll mill setup used properly across coating, ink, pigment, and cosmetic process industries uses the same procedure – only the roller material, speed ratio, and gap sequence change according to the high-viscosity material to be used.
At its simplest, a three roll mill consists of three horizontally positioned rollers — created by three horizontally arranged cylinders working in sequence, the gap between the feed roll and the center roll handles pre-dispersion, and the gap between the center roll and the apron roll finishes the job. Because that basic milling process scales from a 50mm bench unit to a 400mm+ production line without changing in principle, a three roll mill is a versatile machine from lab-scale batches up through full production runs. Three roll mills are widely used — and roll mills are widely used more broadly — across coatings, cosmetics, and electronics wherever fine dispersion matters; three roll mills are used specifically when a process needs more viscosity headroom than a bead mill can handle.
Two levers operators reach for first, with justification: reducing gap leads to greater shear stress the material sees in each nip, and a higher speed differential between rollers gives higher shear rate. Many industry operating handbooks specify a gap of 0.001in (approximately 25μm) as the standard in use, and for additional fineness a tightener is added and repeated until the desired size is obtained over successive passes. That’s the physics-which shows why narrowing gap has a fairly consistent effect until the first few microns of size are reduced.
What it doesn’t tell us is why fineness sometimes stalls out well above our target while the gap has long since achieved mill-rated precision. When that’s the ceiling we operators find ourselves hitting, the gap is almost never the source of the trouble; the culprit is most often one of these other three problems: the wear of the roller alters the gap in effect if not indicated, there’s a mismatch between the viscosity to shear rate for that material, or we’re in the “agglomerate ceiling,” where remaining particles have reached their primary-particle size and subsequent passes are of no use in breaking them further. Roller material choice also influences which of these three you’re more likely to run into. The section below takes us through a diagnostic sequence rather than an approach with one answer.
Troubleshooting a lack of fineness: first, get to understand how the two common test methods actually measure the fineness – because the D90 from a laser diffraction analysis isn’t equivalent to the reading on a grind-gauge, and misinterpreting one as the other is perhaps one of the most frequent ways in which operators convince themselves that they’ve produced a failing batch (or that they’ve produced a passing batch when it should be failing).
Reading Your Grind Gauge, Hegman Scale to Microns
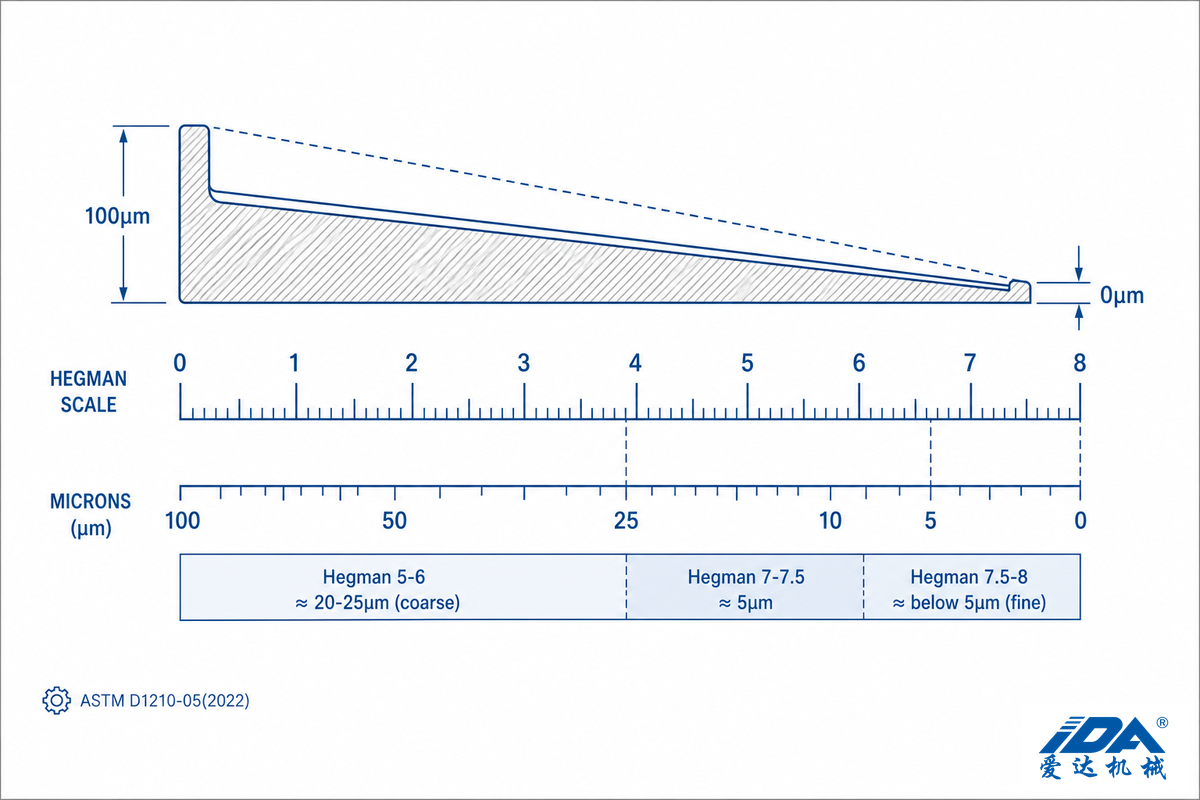
The grind gauge (sometimes known as a Hegman gauge or grindometer) provides a quick, on-the-floor measure of three roll mill particle size between applications. ASTM D1210-05(2022), the Standard Test Method for Fineness of dispersion of pigment-Vehicle Systems by Hegman-Type Gage, was most recently revised in 2005 and reapproved in 2022 without technical changes, and remains the currently approved document to reference. This apparatus consists of a precisely milled steel plate, which has a wedge shaped channel of varying depth (0 – approx 100μm).
A small amount of the product is spread across the length of the channel and read against the inscribed calibrated scale where visible specks or streaks first become visible – the position of this reading on the 0-8 Hegman (or corresponding NS scale) is the grind fineness value.
📐 Engineering Note
Since a Hegman/grindometer is a measure of channel depth and not a laser-diffraction count of particles, all of the reported Hegman-to-micron conversion factors are estimations and can vary from gauge to gauge. As a general guideline, low-to-medium Hegman readings (around Hegman 5 or 6) tend to be coarse in appearance (in the vicinity of 20 to 25 microns) and readings toward the high end of the scale (in the vicinity of Hegman 7.5 or 8) typically indicate a material with a fineness below 5 microns. As always, you’ll need to refer to your gauge manufacturer’s chart because NS and Hegman Scales aren’t the same from brand to brand.
What Hegman reading equals 5 microns?
There’s no single universal number, since Hegman and NS gauge scales vary by manufacturer, but most gauges put 5μm fineness near Hegman 7-7.5, with finer batches closer to 8. If your spec calls for a precise micron value rather than a scale reading, confirm with a laser diffraction analyzer instead, since gauge resolution drops as the channel nears zero depth.
grind gauges are quick – reading one batch takes less than a minute – which is why they’re ideal for monitoring three roll mill particle size between passes through the shop equipment. Here’s exactly what the gauge is actually measuring, though: ASTM D1210 gauges whether pigment agglomerates have been adequately reduced in size so they won’t mar the coating-film, not whether the whole particle size population has the correct distribution. Two batches may have identical Hegman ratings because both have the same coarse tail, but their median particle sizes – and their complete distributions – could be vastly different. Academic literature on particle-size measurement makes the same point about single-point metrics generally: if you need a full understanding of the batch contents, especially with stringent specifications such as for electronic paste or pharmaceutical suspensions, laser diffraction is a necessary complementary method.
Laser Diffraction PSD, What D10/D50/D90 and Span Actually Tell You
Laser diffraction particle size analysis is controlled by ISO 13320:2020, Particle size analysis – Laser diffraction methods, and a related USGS laboratory laser-diffraction study follows the same method family. It’s worth highlighting the edition in full, because many documents on this topic, including several popular guides currently at the top of the search rankings, continue to refer to the canceled 2009 version, ISO 13320:2009, which was technically replaced in 2020. If a supplier’s data sheet or a competitor’s blog post refers to the 2009 version of the standard, consider it a sign that the content has not been updated in some time.
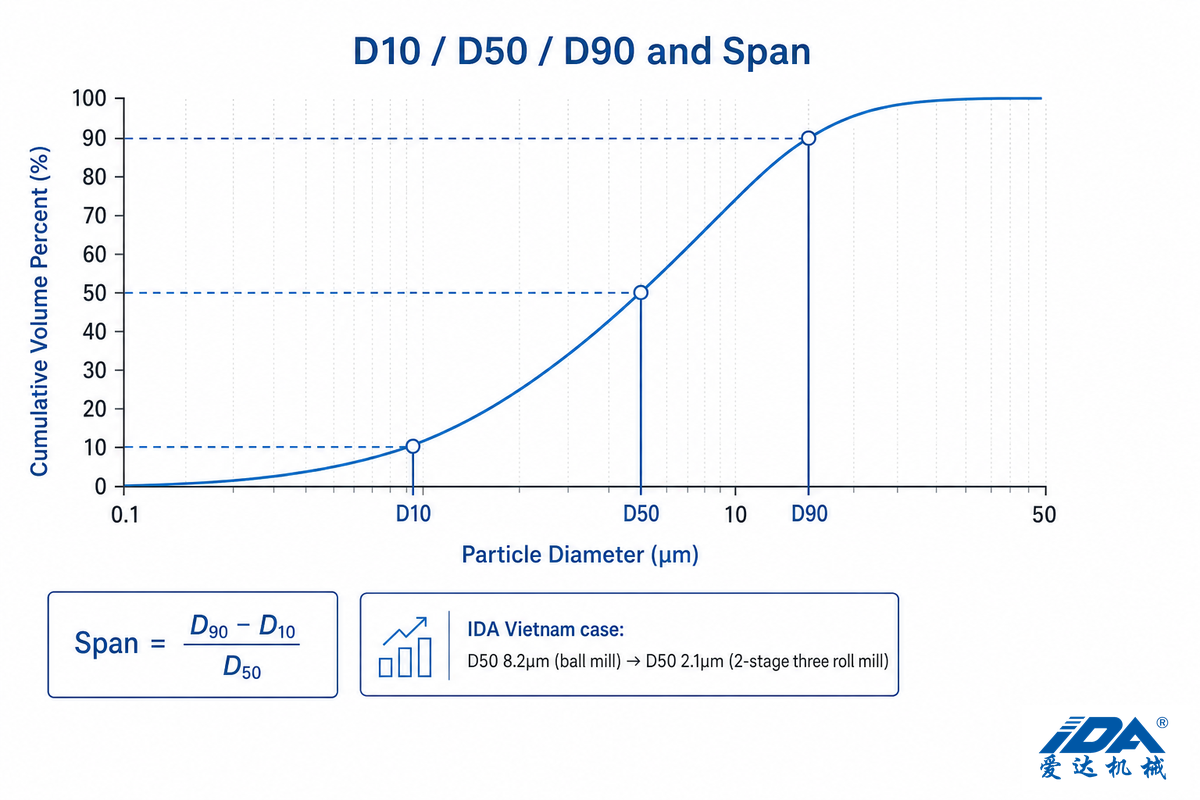
Laser diffraction analysis results don’t yield a single number, but rather a complete particle size distribution that’s often reported as three percentile values: D10 (the particle size at which 90% of particles are larger than this size), D50 (the median – at which half the particles are larger and half smaller), and D90 (the particle size at which only 10% of particles are larger than this size). Also, a derived metric, span, provides a measure of the breadth of the distribution:
Span = (D90 − D10) / D50
A lower span value indicates a narrower, more uniformly distributed population of particles centered around the median. Span is especially useful for detecting batches that might appear to have a good D50 but have an extended coarse tail which drags the D90 outside the specifications-something a grind gauge would miss.
Why this distinction can matter practically is evident from IDA’s testing on an application involving PV silver-paste: one customer was producing 8.2μm D50 (with high variation) using a standard ball-mill method, which fell short of a target paste-supplier specification of <3μm D50 and had an approximate 12% reject rate at the coarser distribution. That same paste ran through a 2-stage grind approach – the first pass was with smaller production three roll mills and the second, a finishing pass, was with hydraulic mill with a gap-servo-adjusted to 2μm – yielding a final D50 of 2.1μm, tighter distribution, and ~2% rejection rate (from 12%). Worth noting is that not only was the mean particle size reduced, but also its variance – which a span calculation could have highlighted prior to looking at rejection data.
Reporting D10/D50/D90 values is standard on nearly all modern particle-characterization equipment, from sophisticated research-level laser diffraction units down to online process quality-control devices. This standardization is helpful; a D90 specification you negotiate with your customer or a raw-material supplier should, in theory, be testable on any laser diffraction unit from any maker.
One caution when treating D90 data as truth: Laser diffraction produces an equivalent spherical diameter – a calculation that determines particle sizes from light-scattering patterns based on a model assuming spherical particles, rather than by direct measurement of particle shape. For roundish pigments or filler materials, the approximation can be quite good, but for flat, needle-like or heavily agglomerated particles, D-values may differ significantly from the actual measured shape viewed under a microscope. Always maintain consistent optical models and refractive indices between instruments when performing comparative analyses, otherwise, changing settings mid-study can result in reported D-values appearing to change without any real shift in the actual process.
Step back from the instrument-specific caveats and the goal is simple: three roll mills remain the standard tool for particle size reduction and for preparing very fine particle dispersions precisely because gap and speed together give you precise control over the particle size distribution — not just an average reading. That precise control lets you reduce the particle size step by step until you reach a uniform particle size and a consistent particle size distribution batch after batch, which is the whole point of running a controlled multi-pass process instead of a single aggressive one.
Pass-by-Pass Gap Sequencing, A Worked Example
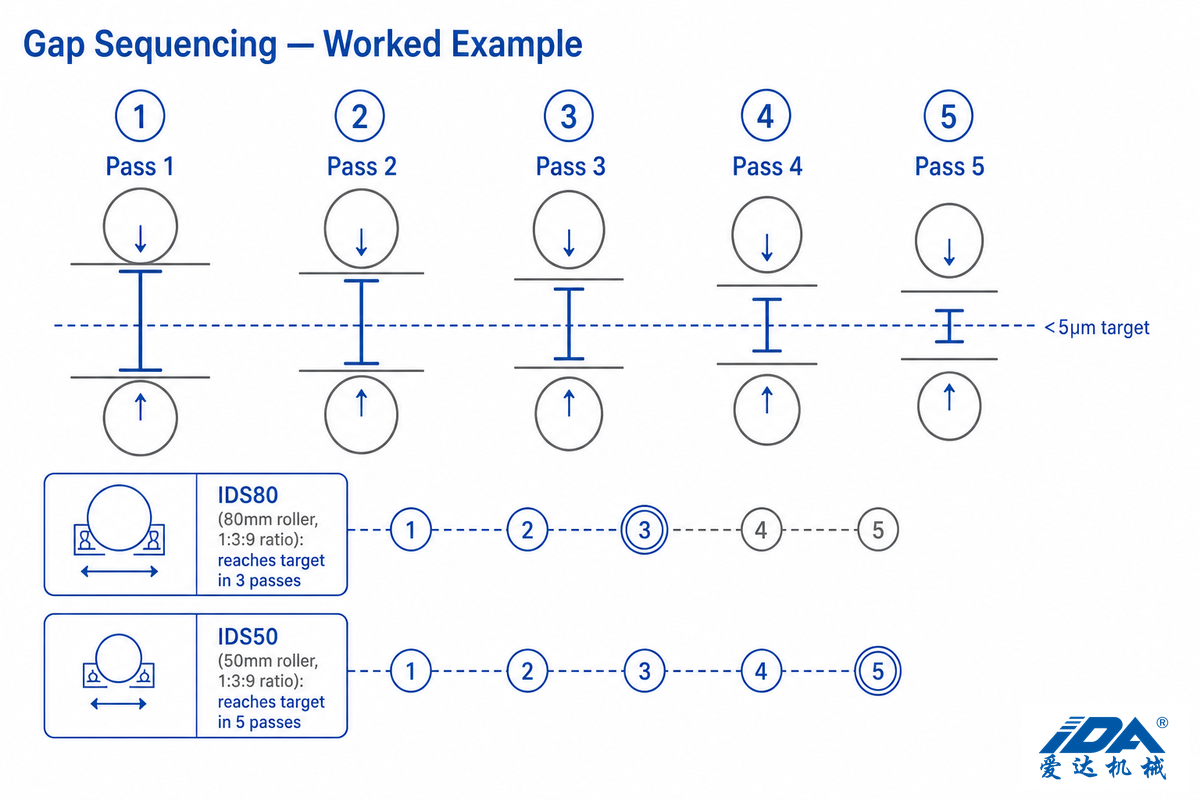
The concept behind gap sequencing is running the largest gap setting first, then successively decreasing it over several passes, as opposed to attempting to achieve a sub-5μm specification in a single pass. Operating with an overly tight gap against a coarse, unprepared feedstock causes two problems: it increases heat and torque, and it may not result in greater fineness significantly more quickly than a carefully designed multiple pass process would. Fracturing larger agglomerate particles is the initial objective, not necessarily achieving the final fineness. A three-roller grinding mill patent covering automatic gap drawback describes the same progressive-tightening logic from the equipment-design side.
| Pass | Purpose | Typical gap direction | Check with |
|---|---|---|---|
| Pass 1 | Break large agglomerates, pre-disperse feed | Widest setting of the sequence | Visual streak-out, coarse grind gauge reading |
| Pass 2 | Reduce mid-range particles, tighten distribution | Meaningfully tighter than Pass 1 | Grind gauge after each pass |
| Pass 3 (finish, small roller) | Final fineness pull-down | Tightest of the sequence, at or near rated gap precision | Grind gauge + laser diffraction for QC sign-off |
| Passes 4-5 (larger roller, same target) | Same final fineness, smaller roller needs more passes to get there | Progressive tightening across two extra passes | Grind gauge each pass |
“Most operators run 3-5 passes. Pass one breaks large agglomerates. Each subsequent pass refines distribution. Check quality with a grind gauge after each pass to hit your target exactly.”
How many passes does a three roll mill need to hit 5 microns?
When targeting <5μm fineness, 3 to 5 passes are typically required. The roller diameter influences where you fall in that range, assuming all else remains constant (material, target, operating conditions): larger diameter rollers transmit more energy per pass than their smaller lab scale counterparts running an identical speed ratio, thus they’re able to achieve fineness in fewer passes than smaller units.
In practical terms, that means don’t assess a mill’s performance by number of passes alone without considering roller diameter and speed ratio. A 5-pass result on a 50mm lab roller can represent the exact same finished fineness as a 3-pass result on an 80mm production roller – the difference in passes is due to roller geometry, not performance.
Best practices for keeping a 3 roll mill running well start with the basics: never let the mill dry between batches, since three adjacent rolls rotating in opposite directions will glaze and score if run without material for more than a few seconds. The take-off knife needs regular sharpening too — a dull edge leaves a thick film of processed material on the apron roll instead of collecting it cleanly. This holds whether the mill is used on one of the smaller bench and floor models in a lab or on a full production line.
Speed Ratio Selection, 1:2:4 vs 1:3:9 and When Each Applies
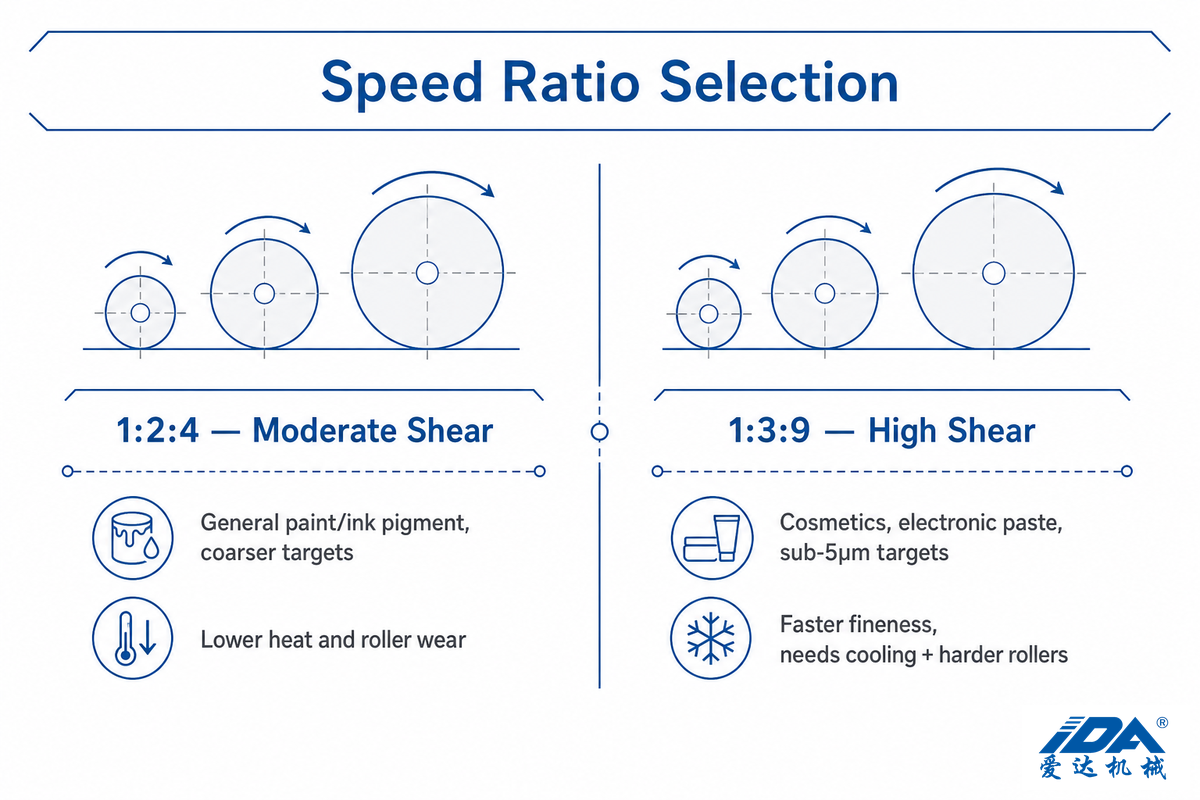
The speed ratio refers to the increasing relative rotational speed between the successive rollers and the feed roll – for example, a 1:3:9 ratio means the center roll runs three times the speed of the feed roll and the apron roll runs nine times the speed. High ratios result in higher stress to the shear in each nip, which in turn allows for smaller particle size targets to be reached, but also creates greater friction heat and more wear on the rollers and bearings. Numerous manufacturers provide a specification sheet for their equipment listing a 9/3/1 speed ratio (equivalent phrasing of 1:3:9), for instance, as their high-shear option alongside a gentler 1:2:4 ratio option for softer applications or less stringent requirements.
| Speed ratio | Shear level | Typical fit | Trade-off |
|---|---|---|---|
| 1:2:4 | Moderate | General paint/ink pigment dispersion, coarser targets | Lower heat and wear, more passes to reach sub-5μm |
| 1:3:9 | High | Cosmetics, electronic paste, sub-5μm targets | Faster fineness pull-down, needs cooling and harder roller material to manage wear |
In the lab or the production line, the choice really comes down to hardness and heat generation during the processing phase. A 2,000,000 mPas viscosity pigment paste having a high hardness value would be a suitable candidate for a 1:3:9 ratio in order to achieve less than 5μm in few passes, assuming the mill is water-cooled and uses ceramic or hardened rollers to mitigate wear. On the other hand, a less hard cosmetic base with a D90 in the less than 10μm range may reach target specs more readily with a 1:2:4 ratio, while generating less heat, and also increasing roller lifespan between maintenance cycles.
We see that this same fundamental concept of manipulating speed relative to volumetric throughput applies in published patent literature in other applications. A patent on an improved particle size distribution for mineral dispersion uses changes in volumetric feed and speed to hit a target particle size; it’s a different packaging of the same relationship between speed ratio selection for a three roll mill.
Since the three rollers rotate at different speeds by design, matching that speed ratio to material hardness is the core decision covered above. When you’re trying to choose the right three roll mill for a new line, it helps to see how established manufacturers handle the same trade-offs — Charles Ross & Son, whose engineering bulletins are cited in the references below, is one well-known Ross three roll mill maker, and comparing a few vendors’ approaches to gap and speed control is a useful way to judge whether a given spec sheet number represents genuine performance.
The Fineness Ceiling: Three-Cause Diagnostic
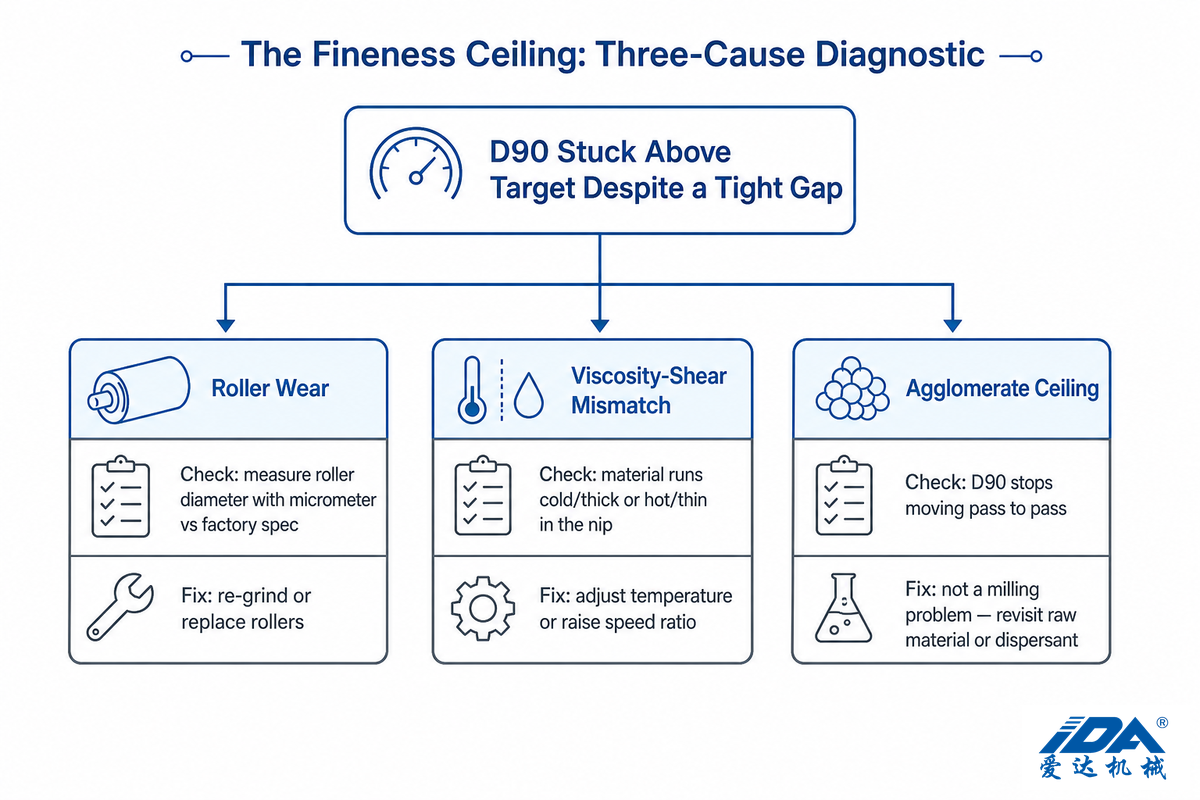
Here’s the scenario the gap-tightening argument misses: the mill has its factory-set precision already built in, the speed ratio selected matches the material’s hardness and fineness target, and yet the D90 is still too high. In such a situation, the solution is rarely, if ever, “tighten the gap.” If the mill is running correctly, it’s already operating at the mechanical limits of what that unit can do, and there’s almost certainly one of three specific problems with the setup.
| Cause | How to confirm it | Fix |
|---|---|---|
| Roller wear (effective gap ≠ indicated gap) | Measure roller diameter with a micrometer against factory spec; check for scoring or pitting | Re-grind or replace worn rollers; re-zero the gap readout after any roller service |
| Viscosity-shear mismatch | Material runs cold/thick and slips in the nip instead of shearing, or runs hot/thin and loses grip | Adjust process temperature/cooling, or step up to a higher speed ratio to add shear without closing the gap further |
| Agglomerate ceiling (primary-particle limit reached) | D90 stops moving between passes even though gap and speed are both correct — further passes make no measurable difference | Not a milling problem — the mill has reached the raw material’s true particle size floor; revisit raw-material grade or dispersant chemistry |
Wear on one of the rollers is the most frequent cause because wear is often invisible in daily operations. Even a severely worn roller can report an accurate reading for the digital gauge (because that number refers to a mechanical position), while the actual spacing between the rollers themselves has increased significantly. Using a micrometer to check against the roller’s original diameter spec can prevent the issue from being caught only after fineness is affected. roller material plays a role in how fast wear happens. The material selection for a ceramic roller will influence its lifespan relative to an alloy-steel one.
As grinding equipment goes, roller material is where a lot of the cost-versus-durability trade-off lives. Hardened steel rolls (often just called steel rolls) are the economical default for general industrial use, and they handle medium to high viscosity viscous materials without issue as long as metal contamination isn’t a concern. Ceramic rolls cost more but remove that risk entirely (see the roller materials guide for the full contamination-risk and cost-per-hour breakdown). Either way, best practices call for inspecting the roller surface regularly for scoring or pitting — that’s the fastest way to catch wear before it shows up as a fineness complaint down the line.
Most frequently, operators mistakenly identify the viscosity-shear mismatch to be a matter of “machine is too weak,” when the actual fix requires only a process parameter adjustment instead of equipment. And the agglomerate ceiling is precisely the one you should be checking last — because it’s the only of the three for which milling adjustment of any kind will no longer do — now the fineness has been kicked upstream to the raw material.
As one piece of illustrative patent evidence for this class of equipment, a published three-roller grinding mill utility patent describes a machine expressly designed to discriminate abrasive particles by size and handle automatic roller drawback — a mechanical solution to the exact problem of wear and clearance discussed above. This shows that roller wear compensation is already known as an issue for this type of equipment, one significant enough to warrant a dedicated patent application.
There’s one other consideration to check before accepting the mill is at a true fineness limit: over-compression itself. Particle characterization studies published about roll crushing have demonstrated that with reduced spacing you achieve both breaking and agglomeration simultaneously, and this means that the D90 that’s reading “stuck” or even ticks upward during passes isn’t always a signal to increase the amount of shear that you’ve applied-instead it’s a signal that the current pass has the effect of re-agglomerating material that has already reached fineness. If you’re reducing the space and the D90 value is getting worse and not better then this suggests backing off one increment of closing and repeating with the same space on the next pass.
Target Fineness by Application, What Should You Actually Aim For?

“Sub-5μm” isn’t an absolute – what’s ‘fine’ will depend in large part upon the end use of the dispersion and how much of the milled material ends up in that end product. Specifying more fine material than the application requires simply results in more passes and more roller wear with no benefit. On the other hand, underspecifying will result in a rejection and the loss of production capacity that can’t be compensated for by simply adjusting the amount of shear.
| Application category | Typical target | Why this level |
|---|---|---|
| Photovoltaic silver paste | D50 below 3μm, tight distribution | Print-line defects and conductivity drops track directly with distribution consistency, not just median size |
| Cosmetics / skin-contact formulations | Below 5μm | Texture and mouth/skin-feel become perceptibly smoother below this range; also a common contamination-testing threshold |
| Pharmaceutical suspensions / ointments | Application-specific, often sub-5μm for API dispersion | Particle size affects dosing uniformity and bioavailability — verify against your specific formulation’s regulatory filing |
| Architectural / industrial pigment paint | D90 below 15μm | Coarser tolerance than cosmetics or electronics; color development and gloss are the binding constraints, not sub-micron uniformity |
| Adhesives / sealants | Varies by filler loading, commonly 5-20μm | Bond-line thickness and filler settling behavior set the practical ceiling, not a universal fineness spec |
| Ink (screen/UV/offset) | Tight pigment dispersion, product-specific | Color depth, shelf-life stability, and printability all move together with dispersion quality |
| Battery electrode slurry | Fine, narrow-span distribution, formulation-specific | Uneven particle size in the slurry translates into inconsistent coating thickness and cell-to-cell performance variation |
| Nanomaterial dispersion (CNT / graphene) | Sub-micron, exfoliation-quality dependent | Controlled shear at low heat build-up allows exfoliation and even dispersion into polymers or coatings without degrading the nanostructures |
| Food-grade (chocolate / confectionery) | Fine, smooth-texture target, product-specific | Perceived smoothness on the palate depends on getting cocoa and sugar particles below the size the tongue can detect |
Note how that “finer is better” isn’t necessarily the guiding principle for any mill system – the acceptable particle size distributions for architectural pigment and adhesives are significantly more coarse than for cosmetics or for electronic paste, because their functional properties such as gloss or bond-line thickness aren’t dictated by very fine particle size control, but in contrast, for example, because strict adherence to very low contamination levels is a requirement of a cosmetics product line — and for the pharmaceutical row above, regulatory literature on particle-size analysis ties the target directly to dosing uniformity, not just texture. When considering particle size specifications for the product and then selecting a grind and mill system the final goal is to select and use those equipment pieces which satisfy those product requirements in an economically justifiable way; one doesn’t default to the most restrictive specification which one may have encountered, or the least expensive.
What’s Changing in Fineness Verification
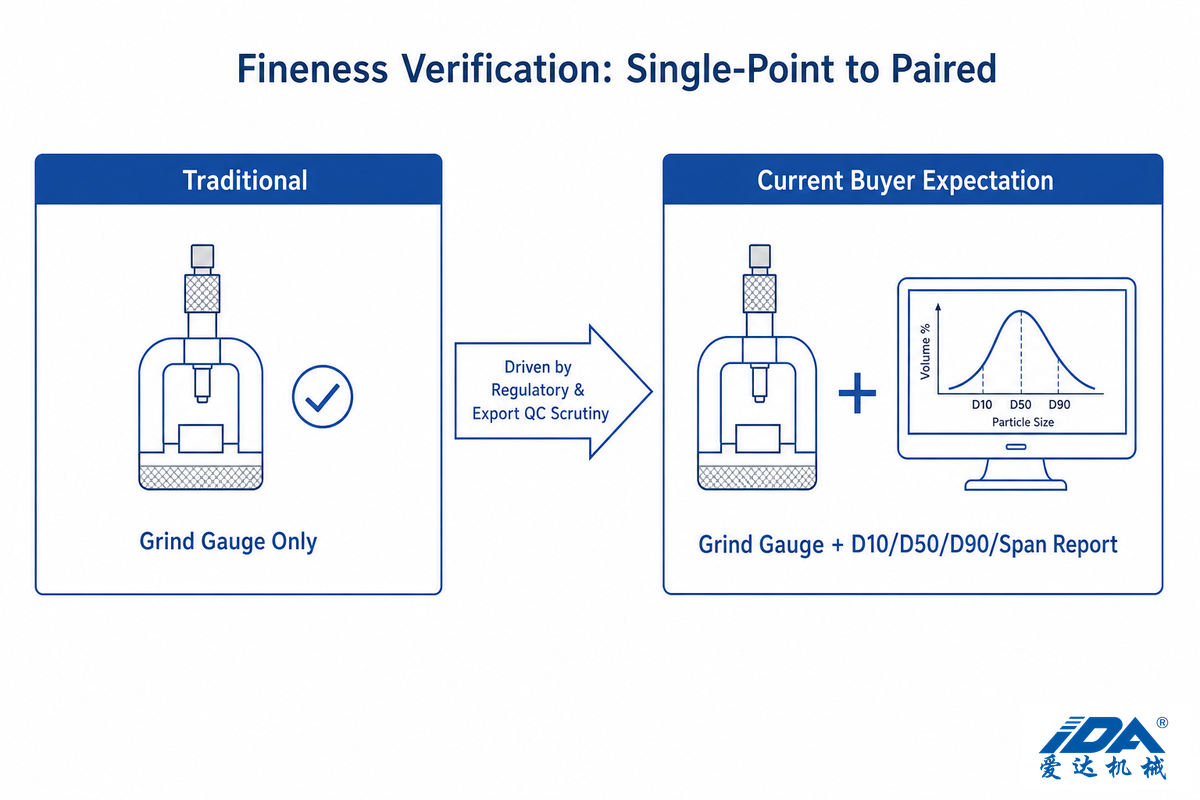
Fineness verification is shifting from single-point checks toward paired measurement: more manufacturers now confirm a grind-gauge reading with a full laser-diffraction particle size distribution rather than relying on either method alone. Tightening scrutiny from regulators and end-users is driving the shift, not a change in how three roll mills grind — buyers increasingly expect documented D10/D50/D90/span data alongside a Hegman number, especially for cosmetics, pharmaceutical, and export-grade specifications.
Clearly the driving factor behind the way the fineness is being checked now isn’t a change in the way we perform the mill step, but the increase in the scrutiny by end-users and regulatory bodies of product quality leading to more and more users utilizing two, not just one measurement methods. This is demonstrated by the IDA cosmetics product application, where for example a European customer’s launch of a new liquid foundation formulation necessitated confirmation of zero heavy metal contamination by ICP-MS due to stringent EU regulations – that’s in addition to checking particle size distribution to confirm a grind reading and ensure no roller contributed metals were present from the roller material (ceramic vs. alloy steel).
One more point made by the particle-size measurement literature is useful for anyone contemplating the design of a QC process around the topic: “full distribution analysis” (as is produced by laser diffraction) is generally considered a more justifiable basis for quality-system/regulatory sign-off than is either a standalone, single-point measurement, such as a grind gauge reading or just a number-based D50 without span. If you’re setting up a QC protocol in 2026 to address a tight-specification process-e.g., for electronic paste, pharmaceutical, or export cosmetics-then budgeting for both a grind gauge (quick in-line check between passes) and periodic laser-diffraction confirmation (full-distribution QC sign-off) is more defensible than betting on a single measurement device to provide all the information needed to assess product quality.
Market researchers expect the particle-size analysis market to continue expanding through the end of the decade, based on market research forecasts; that data offer only a directional signal of expanding investment throughout the industry, however-it tells you neither what nor how to measure, so regulatory/full-distribution considerations are more significant in practice than raw market growth numbers.
Need Help Diagnosing a Fineness Shortfall?
Send a sample and current parameters for your target fineness to the IDA Jiangyin laboratory and its engineers will perform a free trial, diagnose one of the three fineness ceiling causes, and return both a full grind-gauge and laser-diffraction analysis.
Frequently Asked Questions
Q: How many passes does a three roll mill need to hit 5μm?
View Answer
roller diameter (though often cited only as a secondary control) is the variable in most 3-5 pass runs for sub-5-micron particles; for a large-diameter roller, you could achieve the same sub-5-micron fineness in 3 passes at a 1:3:9 speed ratio, whereas a small lab-scale unit with a 1:3:9 ratio would typically require 4 or 5 passes. Track passes with a grind gauge at the end of each run; don’t assume you can simply forecast passes for the next run based on the previous run. Batch-to-batch variation dictates the actual number of passes required for the specified target.
Q: What’s the difference between D50 and D90 for QC sign-off?
View Answer
The D50 is the “median” particle size; 50% of particles are coarser, and 50% finer. D90 indicates the particle size below which 90% of the material is found, meaning it’s defined by the 10% coarser end of the particle distribution, not the center of the distribution. Therefore, you can get a perfectly fine D50 and a very coarse D90 and end up with a batch that fails a specification-that’s why span-(D90-D10)/D50-is such a useful descriptor.
Q: Can I rely on a grind gauge alone, or do I need laser diffraction too?
View Answer
Although the grind gauge is ideal as the initial check on the shop floor (it’s quick and gives good within-batch comparisons), its reading represents only a single threshold, and two different batches with identical grind readings might have very different median particle sizes. For finer, tighter-spec processes like electronic paste or export cosmetics, using a grind gauge in conjunction with laser diffraction (e.g., ASTM D1210-05(2022) plus ISO 13320:2020) will provide fast process checks in line, and complete full-distribution reports for regulatory/quality system sign-off.
Q: Why does D90 stay high even after tightening the gap to 1μm?
View Answer
When you’ve reached your mill’s rated precision on the gap, a stuck D90 is almost never about the gap – it’s one of three other possibilities. Always first consider the roller condition: it can appear to be OK on digital display while still actually being worn to the point that your true material-to-material clearance is significantly increased. (Measure actual roller with a micrometer against a factory measurement chart to confirm.) If rollers are good, investigate your material viscosity relative to current speed ratio – it can get too thick/cold and slip instead of shear. If neither of those is a problem, and D90 truly stops making progress, you’ve probably encountered an agglomerate limit, the point where the residual particles have reached primary-particle size and can’t be further reduced with the mill. This is a material-science / dispersant chemistry problem, not a mill parameter problem.
Q: What Hegman/grind-gauge reading corresponds to 5 microns?
View Answer
Somewhere between Hegman 7 and 7.5, depending on the exact gauge manufacturer (see gauge-specific chart for confirmation against spec).
The Team Behind This Report
This fineness-troubleshooting playbook was compiled by Jiangyin IDA Equipment’s process optimization team, drawing on gap-sequencing and speed-ratio case data from IDA’s own three roll mill installations across photovoltaic, cosmetics, and pigment-grinding applications. Reviewed by the Jiangyin IDA Equipment Co., Ltd. technical team. (Updated July 2026)
References & Sources
- ISO 13320:2020, Particle size analysis, Laser diffraction methodsInternational Organization for Standardization
- ASTM D1210-05(2022), Standard Test Method for Fineness of Dispersion of Pigment-Vehicle Systems by Hegman-Type GageASTM International
- Size Analysis with a Laboratory Laser-Diffraction AnalyzerU.S. Geological Survey
- Mastering Particle Size Analysis: Lessons, Challenges, and Future DirectionsNational Center for Biotechnology Information (PMC)
- Setting Particle Size SpecificationsHORIBA Scientific
- EP3002318A1: Process for Improving Particle Size Distribution of Calcium CarbonateEuropean Patent Office (Google Patents)
- CN205965983U: Three-Roller Grinding MillChina National Intellectual Property Administration (Google Patents)
- Create Smooth, Speck-Free Pastes in Your Three Roll MillCharles Ross & Son Company, Mixing Technology Reports
- Simultaneous Breakage and Agglomeration Effects in Roll-Based Size ReductionPowder Technology (ScienceDirect)
Related Articles
- Three Roll Mill Guide: Working Principle, Selection & Usefull buyer’s overview, including the 4-Factor Selection Matrix
- Lab Three Roll Mill: The 5-Point Fit Check Before You Buybench-scale (ES50) sizing and scale-up considerations
- Three Roll Mill vs Ball Millthe 100,000 mPas crossover point and when each technology wins
- Three Roll Mill Maintenanceroller alignment, lubrication, and inspection schedules that prevent the wear-driven fineness ceiling covered above
- Silver Paste Grindingdeeper dive into the photovoltaic conductive-paste application referenced in the laser diffraction section